


Tably promises a fresh, fast way to work together on data. If you have ever bounced between spreadsheets, docs, dashboards, and chat threads just to get a single analysis out the door, you know how scattered data work can feel. Tably aims to pull that mess into one place. It’s built for people who want to share insights quickly, collaborate without friction, and keep their work organized from first draft to final handoff. In this review, I’ll walk you through what Tably is, why it matters, the features that stand out, how pricing fits different team sizes, and which alternatives you might compare it against.
This review is written for you—the analyst who lives in tables, the operations manager who needs clear answers, the founder who wants decisions, and the teammate who just wants the data conversation to feel easier. Read on to see whether Tably can help you deliver cleaner data work, fewer miscommunications, and faster outcomes for your team.
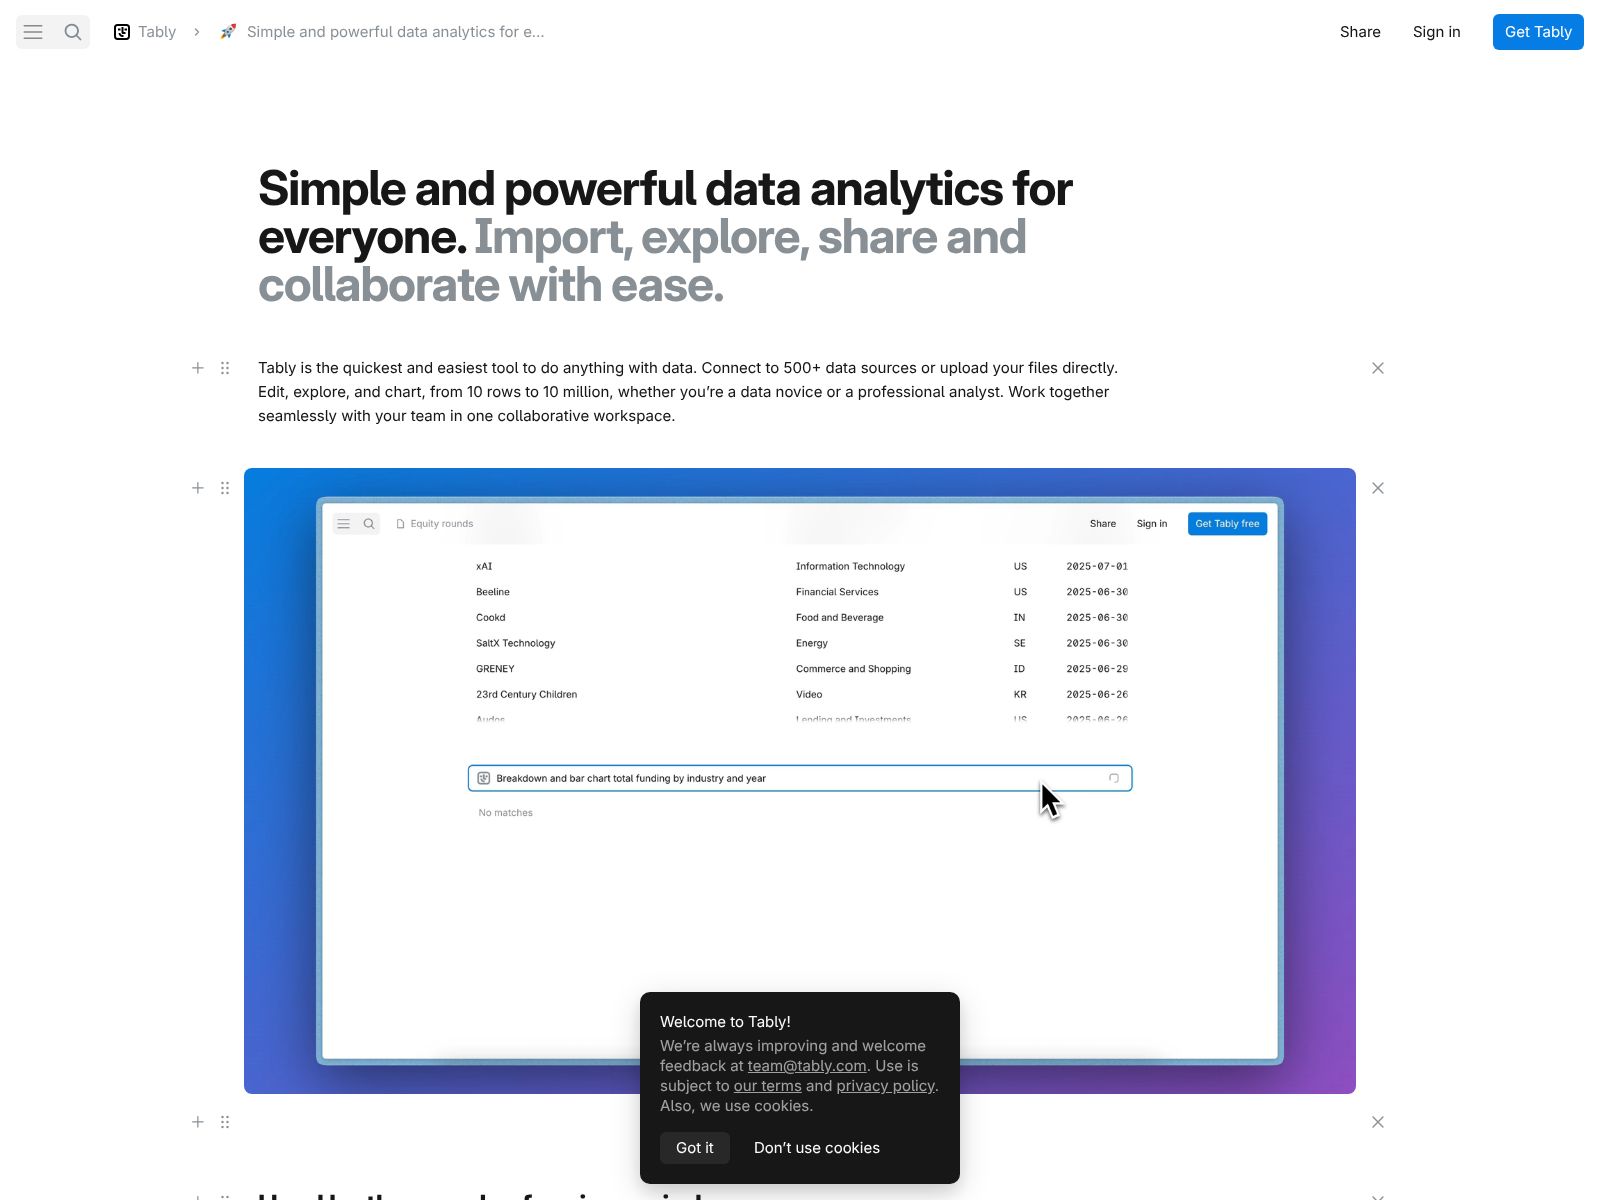
Tably is a collaborative space where you and your team can share, explore, and discuss data work in one place. You can bring data in, build tables and views, add context, and collaborate in real time—without fighting multiple tools or losing the thread.
• Real-time collaboration that feels effortless. Multiple people can work in the same space at the same time, with changes appearing instantly. Presence indicators and clear editing feedback make it easy to know who is doing what, so your team stays in sync without stepping on each other’s toes.
• Fast, flexible tables for real work. Organize data the way you think: rows and columns for inputs, derived fields for outputs, and filters to focus. The table experience is designed to be quick, familiar, and responsive, so you can move from import to insight without delays.
• Views that match your workflow. Create filtered, sorted, and grouped views to focus on what matters for a specific question or stakeholder. Save those views so others can open them and instantly see exactly what you meant—no extra instructions needed.
• Context next to numbers. Add notes, sections, or light documentation right alongside your data so the “why” and “how” travel with the “what.” This helps new teammates onboard faster and reduces repeated explanations.
• Commenting and discussion where the work happens. Leave targeted comments on cells, tables, or sections. Mention teammates for quick input. Keep decisions clear and searchable, so you can trace how the final call was made without hunting through chat history.
• Version awareness that encourages change without fear. Track edits over time and roll changes forward confidently. When you know you can revert or review history, you experiment more and ship better results.
• Clean imports for common formats. Bring in CSVs, spreadsheets, and other structured data cleanly. You can standardize columns, fix types, and get to the point quickly, whether you’re preparing a one-off analysis or maintaining a recurring process.
• Intuitive transformations and filters. Use simple, readable operations to filter rows, compute derived values, and tidy data for stakeholders. The goal is to make common steps feel quick and obvious, even for teammates who aren’t “data people.”
• Lightweight visualization to make patterns pop. Build quick charts tied to the same underlying tables. Stay in the flow: adjust fields, switch chart types, and show the trend you want without exporting to another tool.
• Clear permissions for teams of all sizes. Invite colleagues, clients, or partners with the right level of access. Limit editing when you need a stable view; open it up when you want more hands on the work. Strong basics make sharing safe and simple.
• Workspaces that scale with your org. Organize by team, function, or project. Keep related datasets and artifacts together so people can find what they need and follow ongoing work without asking around.
• Snappy performance that respects your time. From the first keystroke to large-table interactions, Tably focuses on speed. You should be able to import, navigate, type, and collaborate without thinking about the tool itself.
• Keyboard-first design for power users. Use shortcuts to move, edit, and create. Small interaction details add up to big time savings, especially for people who spend hours a day working with tables.
• Simple sharing for stakeholders. Create links for colleagues who need to review or comment without becoming full-time editors. You can present data, capture feedback, and move to a decision in one place.
• Templates to jumpstart common workflows. Start faster with setups for recurring tasks like reporting, project tracking, or planning. Templates help your team standardize processes and onboard new collaborators with less effort.
• Notifications that surface what matters. Get notified when someone mentions you, requests input, or changes a shared view. Keep the signal without drowning in noise, and configure updates to match how you like to work.
• Search that finds work quickly. Locate tables, views, and discussions across your workspace. Whether you remember the title, a field name, or a decision thread, you can get back to it in seconds.
• Gentle learning curve for mixed-skill teams. Tably is approachable for non-technical teammates and still powerful enough for advanced users who want to move quickly. Clear language and clean design keep focus on the work, not the UI.
• Clear data lineage in context. As you iterate—import, transform, and present—your team can follow the flow from source to result. When someone asks, “Where did this number come from?” you have an answer close at hand.
• Live collaboration replaces handoffs. Instead of emailing files or uploading static attachments, you can co-edit and comment in place. This cuts the cycle time between draft and decision and reduces version chaos.
• Embeds and sharing across your tools. Bring Tably work into the places your team already lives—docs, wikis, or project hubs. Your data stays up to date and clickable, without duplicative copies.
• Security and privacy built as fundamentals. Workspaces, permissions, and sensible defaults help you keep data where it belongs. As your usage grows, you can align sharing practices with your organization’s policies.
• Built for both quick explorations and durable processes. Whether you’re answering a today-only question or building a repeatable weekly report, the same space can handle it. You don’t need one tool for scrappy drafts and another for polished deliverables.
• Fits teams that span roles. Analysts, operators, marketers, and product managers can all work inside Tably without needing separate technical stacks. This means better collaboration and fewer “lost in translation” moments.
• Reliable exports for downstream needs. When it’s time to hand off a dataset to another system or archive finished work, export without surprises. Clean outputs help you keep options open.
• Free and paid plans tailored to your growth. You can start at no cost, then upgrade as your needs expand. Paid tiers typically unlock more capacity, advanced collaboration, admin controls, and support—useful when your team scales or your data work becomes mission critical.
• Designed for joy, not just utility. The interface aims to be delightful to use. Small touches—smooth interactions, thoughtful defaults, and clear language—reduce friction so you can focus on insight, not the tool.
If your team’s data work is scattered today, Tably can act as a home base. Imagine a world where the weekly metrics, the ad-hoc investigation, and the stakeholder summary all live side by side. You can run a quick check, annotate what changed, and notify the right people in minutes. Instead of losing momentum, you gain it, because everyone can see the same current state and add meaningful contributions right away.
For teams that already have a data warehouse or BI dashboards, Tably complements those investments by giving you a collaborative environment for the messy middle—the place where questions are shaped, data is refined, and decisions are made. For teams without heavy infrastructure, it provides a simple, approachable way to do the entire loop: collect, shape, discuss, and share.
• Quick, collaborative analysis with clear context. You can move from raw data to a shareable, discussed outcome in one continuous flow.
• Mixed-skill teams that need a single tool. Analysts, operators, and stakeholders can all participate without feeling blocked or overwhelmed.
• Fast iteration and decision-making. Real-time editing, comments, and saved views make it simple to propose a change, test an idea, and collect feedback.
• Repeatable reporting with less glue work. Templates, permissions, and clean exports help you maintain recurring processes without rebuilding them every time.
If your work involves tables, updated numbers, and shared decisions, you are in the sweet spot. Teams in operations, growth, product, finance, support, and customer success can all benefit. Early-stage startups can use Tably as the central hub for metrics and planning. Larger organizations can use it to bridge the gap between data producers and decision makers, reducing the back-and-forth that often slows things down.
• Airtable: A popular spreadsheet-database hybrid with powerful views and automations. Airtable is great for structured workflows; Tably focuses more on collaborative data work with context and discussion in the same place.
• Notion (databases): Notion databases help teams capture and organize information alongside documentation. If your work is mostly knowledge management with light data needs, Notion may fit; if you need faster, table-first collaboration, Tably offers a more focused experience.
• Coda: A flexible doc platform that blends tables, formulas, and pages. Coda shines at building custom docs-as-apps. Tably zeroes in on the speed and clarity of collaborative data work with less setup.
• Google Sheets: Ubiquitous, familiar, and simple to share. Sheets is excellent for quick spreadsheets, but it can get messy for multi-user workflows and context-rich discussions; Tably adds structure, context, and collaboration without breaking your flow.
• Microsoft Excel for the web: A classic for analysis with web-based collaboration. If you rely on Excel formulas and the larger Microsoft ecosystem, it’s a strong baseline; Tably offers a lighter, conversation-forward approach to shared data work.
• Rows: A modern spreadsheet with integrations and sharing features. Rows is great for pulling data from apps into spreadsheets; Tably centers the shared analysis and decision-making loop in one place.
• Smartsheet: Built for project and work management with spreadsheet-like views. If you need detailed project workflows, Smartsheet is a fit; for collaborative data exploration and reporting, Tably is a simpler, faster space.
• Hex: A collaborative notebook for data teams. Hex is strong for Python- and SQL-driven analysis; Tably aims to make table-first collaboration simple for a wider team audience without steep technical setup.
• Deepnote: A collaborative notebook platform focused on data science. It’s powerful for code-centric teams; Tably fits better where non-technical teammates also need to move quickly with tables and context.
• Mode: Often used for SQL analysis and dashboards. Mode is great for query-driven reporting; Tably brings everyday data collaboration and conversation into one environment for faster iteration.
• Observable: A platform for interactive data visualizations. If you need custom visual work, Observable excels; Tably keeps visuals simple and tied directly to your collaborative tables and decisions.
Tably offers both free and paid plans so you can start immediately and scale as your needs grow. The free plan is ideal for individuals and small teams getting a feel for the workflows and collaboration model. As you expand, paid plans generally add capacity, advanced collaboration options, administrative controls, and support—useful for growing teams that need reliability, governance, and help rolling out the tool more broadly. If you anticipate a rapid rollout across a department or company, it’s worth exploring paid tiers early to ensure you have the right limits and controls in place.
• Do you rely on tables and shared context to make decisions? If yes, Tably’s table-first approach with embedded discussion can streamline your workflow.
• Do non-technical teammates need to contribute to data work? If you want a tool that welcomes everyone, Tably’s approachable design can help you collaborate without gatekeeping.
• Are you juggling multiple tools to get simple analyses out the door? If you’re switching between spreadsheets, docs, and chat, consolidating into Tably can reduce friction and speed up decisions.
• Do you value repeatable processes as much as quick experiments? Tably supports both, so you don’t have to pick a tool for each type of task.
• Use it for your next weekly metrics roundup. Import the latest numbers, add short commentary, create a stakeholder view, and ask for feedback—all in one place. Notice if the time from collection to decision shrinks.
• Run a small cross-functional project. Invite people from operations, product, and marketing. Put the key tables and discussions in Tably, and see whether alignment improves without extra meetings.
• Replace one spreadsheet-and-doc combo. Take a recurring process that lives in two tools and move it into Tably. Measure how many steps you save and how much clearer your final artifact becomes.
• Strengths: Speed, clarity, and collaboration are front and center. Tably helps your team share work, capture context, and converge on decisions without unnecessary ceremony. The learning curve is gentle, and the overall experience aims to be enjoyable, not just functional.
• Trade-offs: If your team needs deep, code-heavy analytics or highly customized visualizations, a notebook or specialized BI tool may still be part of your stack. Tably’s value is in making collaborative data work faster and clearer; it’s not meant to replace every specialized analytics tool you might use.
• Choose a high-visibility use case. Start with a process that matters and recurs, like weekly KPIs or a cross-team initiative. Early wins create momentum and show the payoff of collaborative data work.
• Establish simple norms. Decide how you’ll name tables and views, where comments live, and when to archive older work. Light structure turns good intentions into reliable habits.
• Keep stakeholders in the same space. Invite decision makers to view and comment directly in Tably. The fewer screenshots and attachments, the better the outcomes.
• Reuse what works. When you hit a clean setup, save it as a template and share it. Consistency builds speed over time.
Many tools promise collaboration, but the experience often adds friction: version conflicts, scattered commentary, or slow, heavyweight UIs. Tably’s approach is to make the core loop—share, shape, discuss, decide—feel direct and immediate. The table is quick. The discussion is right there. The next step is obvious. When that loop feels natural, your team moves faster and trusts the process more. Over time, that trust turns into better decisions and smoother execution.
• Your weekly reporting goes from a multi-tool relay race to a single shared space that everyone can open and understand.
• The question “Where did this number come from?” gets answered with a click, not a 20-minute hunt.
• Non-technical teammates add real contributions—notes, checks, or edits—because they feel comfortable in the tool.
• Decisions are documented next to the data that informed them, so future teammates can learn quickly and avoid repeating old debates.
• Marketing performance reviews: Import channel results, annotate changes in spend, and align on next actions in one view.
• Product and operations metrics: Track daily or weekly health, add context on experiments, and keep leadership synced without extra slides.
• Finance and planning: Build lightweight forecasts, compare scenarios, and record assumptions alongside the numbers.
• Customer success: Monitor account health inputs, share renewal risks with context, and update plans collaboratively.
You can begin on the free plan, create a workspace, and invite a few teammates to try a single process end to end. Focus on a concise goal, like “Produce our weekly summary in less time with clearer context.” After one or two cycles, assess whether discussions are easier, decisions are faster, and handoffs are reduced. If you feel the momentum, expand to a second use case and evaluate whether a paid plan would support broader adoption, more capacity, or admin needs.
Tably is built for people who want the quickest, easiest, and most enjoyable place to share and collaborate on data work. It blends fast tables, real-time collaboration, and clear context into a single space that helps your team move from raw inputs to decisions without the usual friction. If your data workflows span multiple roles and you care about speed and clarity, Tably is worth a serious look.
Start small: pick one recurring process, bring it into Tably, and run it there for two cycles. If your team spends less time stitching tools together and more time agreeing on next steps, you’ll have your answer. From there, the path is simple—reuse what works, invite the right people, and scale the practices that lead to better decisions. That’s the promise of Tably: a calmer, faster, and more collaborative way to do your best data work.