Kalshi vs Polymarket Review & Overview (Features, Pricing, & Alternatives)
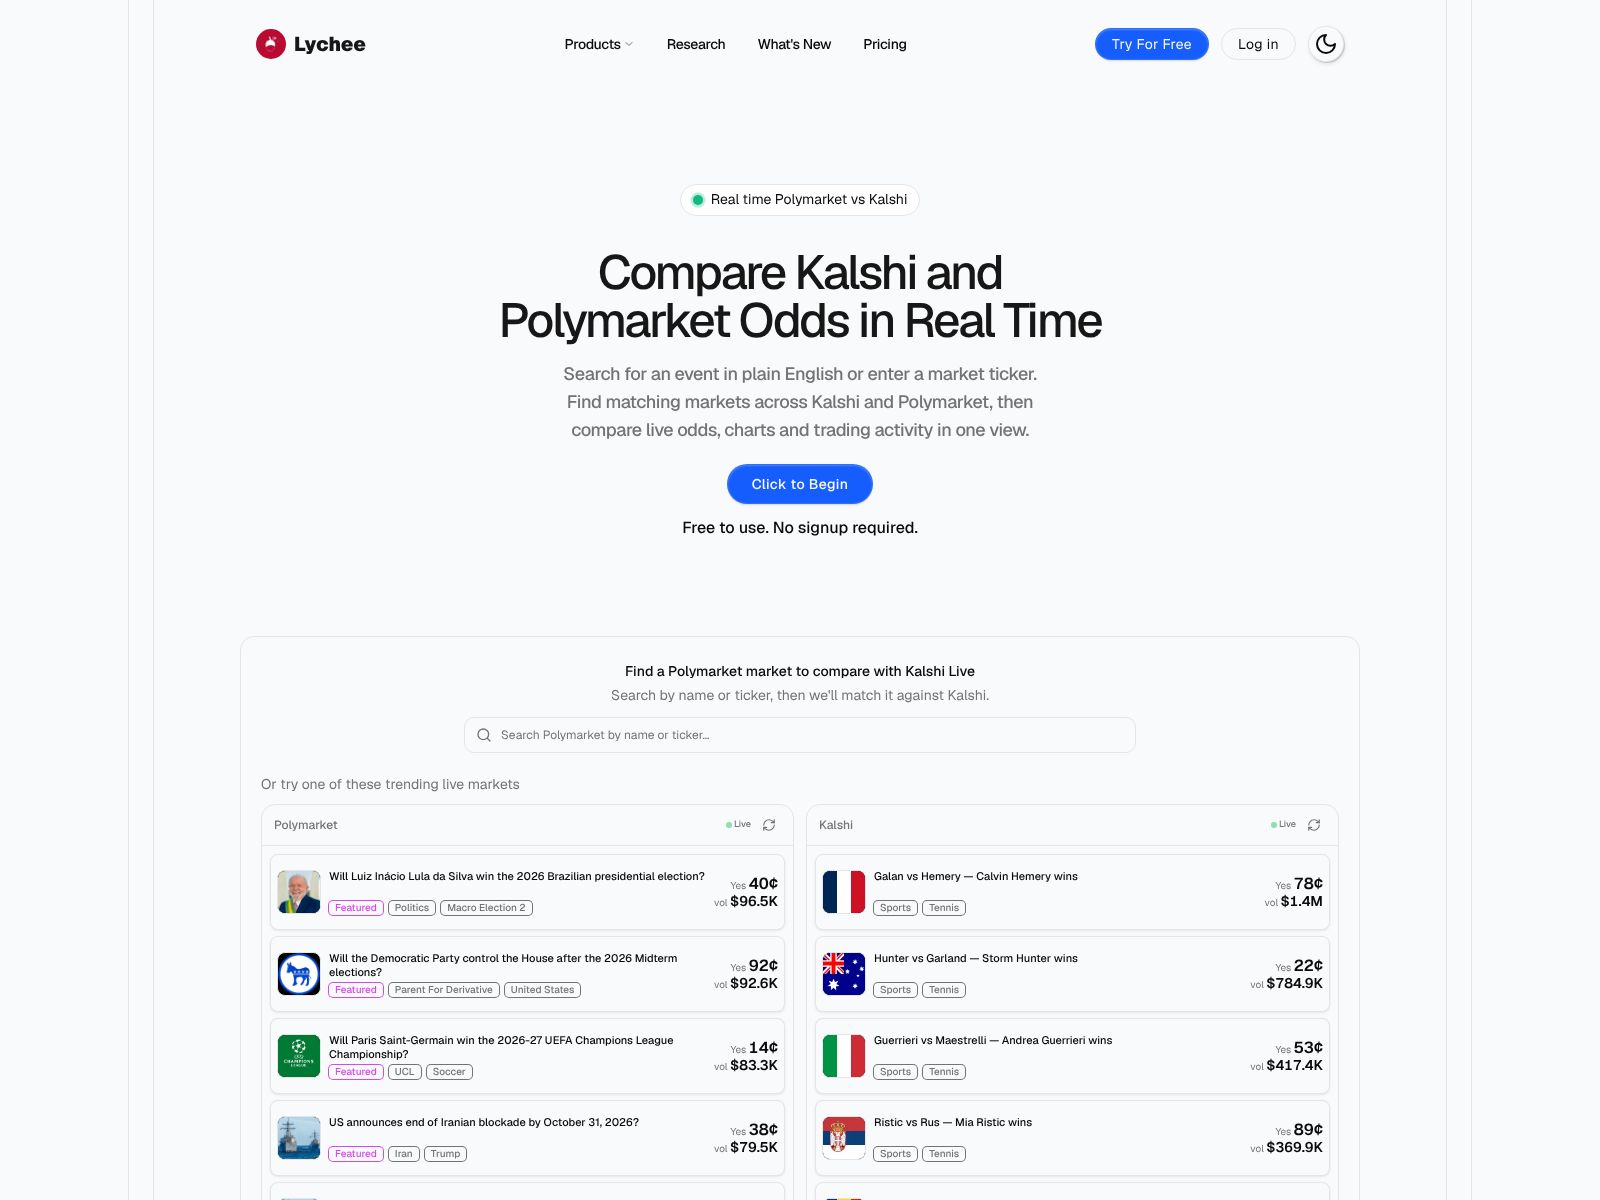
If you’re trading prediction markets, researching public expectations, or just trying to make sense of where the crowd thinks an event is headed, you’ve probably noticed something odd: the same event can have different odds on different platforms. That’s the core idea behind Kalshi vs Polymarket by Lychee—“One event. Two markets. Different odds.”
In this review and overview, I’ll walk you through what Kalshi vs Polymarket is, why it matters, what you can do with it, and how it compares to other ways of tracking event probabilities. My goal is to help you decide if this tool is right for your trading workflow or research stack, and give you a few practical tips to use it well.
Quick link if you want to jump in now: Kalshi vs Polymarket by Lychee. It’s free to use and requires no signup.
What does Kalshi vs Polymarket do?
Kalshi vs Polymarket lets you search for an event, find the matching contracts on both Kalshi and Polymarket, and compare their live YES/NO prices side by side or on the same chart. You can also inspect recent trades, volume, and order books to see what’s driving each move.
Why compare odds across platforms?
Two platforms can show different odds for the same event. That spread can appear for lots of reasons—who’s trading there, how the markets are structured, fees, liquidity, time of day, catalysts, and even the way each question is worded. If you care about getting the best read on “what the market thinks,” or if you’re looking for opportunities, comparing venues gives you a more complete picture.
Here are a few concrete reasons you might want to compare:
- Find divergence: Spot when Kalshi and Polymarket disagree and track how that gap widens or narrows over time.
- Understand liquidity: See where the depth is, and how that might influence price stability or slippage.
- Check price reaction: Overlay charts to see how each market reacted to the same piece of news.
- Validate your thesis: If both markets move together, you may gain confidence. If they differ, you may ask why.
- Improve sourcing: Journalists and researchers can quote cross-platform prices, not just one venue.
Kalshi vs Polymarket Features
Here’s what you can do inside the tool today:
- Plain-English search and ticker search: Type in what you’re looking for (e.g., “US CPI” or a known ticker) to surface matching events.
- Contract mapping across platforms: The tool finds corresponding questions/contracts on both Kalshi and Polymarket so you can compare like-for-like as closely as possible.
- Live YES/NO prices: View current prices and implied probabilities at a glance.
- Side-by-side or overlay charts: Either place the markets next to each other or overlay their price histories to compare moves across the same time window.
- Recent trades and volume: See the flow behind the chart—who traded when, and how much traded in recent periods.
- Order books: Inspect active bids and asks to understand liquidity, spreads, and where the next move might meet resistance.
- Time window controls: Zoom in on the last minutes or hours to track a breaking story, or zoom out to spot longer-term trends and regime shifts.
- No account needed: It’s free and works in your browser without signup or wallet connection.
In short, Kalshi vs Polymarket is built to help you discover where the platforms agree, where they don’t, and how those differences evolve over time—without bouncing between multiple tabs and tools.
Pricing
Kalshi vs Polymarket is free to use and does not require signup. You can load the site, search for events, compare markets, and explore charts and order books right away. If you’re budget-conscious, that makes it a low-friction way to add cross-platform visibility to your workflow.
Pros and Cons
Here’s a quick, honest look at the upsides and tradeoffs you should know about.
Pros:
- Free and no signup: Start using it immediately, even on a mobile device.
- Purpose-built comparison: It focuses specifically on Kalshi and Polymarket, where many of the most-watched event markets live today.
- Clear visualization: Side-by-side and overlay views make pattern recognition fast.
- Depth beyond price: Recent trades, volume, and order books help you diagnose what’s driving price changes.
- Straightforward search: You don’t need to know exact tickers—plain-English search works.
Cons:
- Scope: It currently focuses on two platforms. If you want a unified view that includes every prediction site, you’ll still need other tools.
- No trading from the page: It’s a research and comparison interface, not a broker or exchange.
- Contract mapping limits: Not every Kalshi and Polymarket market will have a perfect one-to-one match due to different question wording or settlement criteria. You should always read the underlying market text before acting.
- Data dependencies: Live views are only as timely as each platform’s available data and any third-party refresh limitations.
Who is Kalshi vs Polymarket for?
- Active traders: If you trade on Kalshi or Polymarket, this tool shows where the other venue sits right now, and how that has changed since your last check.
- Quant and discretionary researchers: If you build theses around public expectations, relative mispricings, or event probability drift, overlaying two venues helps you test ideas.
- Journalists and analysts: If you cite prediction markets in your reporting, comparing venues provides a more balanced reference point.
- Policy watchers and academics: If you’re studying information flow, market microstructure, or event forecasting, the live and historical comparisons are helpful context.
- Teams building dashboards: If your team curates event risk for clients, this is an easy way to enrich your analysis without building a cross-venue data pipeline from scratch.
How to use it: A quick workflow
- Search the event: Type the topic, event name, or ticker. For example, an economic release, a policy decision, or a major political race.
- Select the matching contracts: Confirm that the Kalshi and Polymarket questions refer to the same outcome and settlement criteria.
- Choose your view: Use side-by-side to compare current prices and spreads; use overlay to study how each venue reacted over time.
- Check recent trades and volume: Look for bursts of activity, block-like prints, or volume dry-ups that explain a price step.
- Open the order books: Gauge the depth at price levels and see whether near-touch liquidity is supporting or resisting a move.
- Adjust the time window: Zoom in for intraday catalysts or out for longer drift and mean-reversion behavior.
- Cross-check market text: Before you rely on a divergence, re-read each platform’s question wording and settlement source to reduce mismatch risk.
- Document and share: Take notes or screenshots for your journal, memo, or client update. Since it’s a public page, you can share links with teammates.
Real-world examples and use cases
Here are a few ways you might apply Kalshi vs Polymarket to your day-to-day decisions:
- Economic prints: Before a data release (like inflation, jobs, or growth), compare odds and watch how each venue reprices in the minutes after the number hits. One venue may react faster; the other may show more staying power if liquidity is deeper.
- Policy decisions: For central bank meetings or regulatory decisions, compare pre-meeting drift across both platforms. Then monitor the “decision candle” and post-event digestion on the overlay chart.
- Political events: Track how odds move around debates, endorsements, or legal rulings. If a headline shifts one platform but not the other, that divergence is a data point worth investigating.
- Tech and business milestones: For launches, approvals, or earnings-linked outcomes, contrast how crypto-native versus regulated exchange traders respond to rumors versus official confirmations.
These comparisons can help you do more than spot “arbs.” They help you understand market structure—who trades where, what kind of news moves each venue, and how liquidity shapes price discovery.
How it thinks about contracts and comparability
Comparing event markets requires care. Even when two questions look the same, subtle differences in wording, rounding conventions, time zones, or settlement sources can matter. Kalshi vs Polymarket helps by surfacing the best corresponding contracts and aligning price histories in a single place, but you should still click through to each underlying market page and confirm details before drawing a firm conclusion.
As a best practice:
- Read the full market text on each platform.
- Note any conditional clauses or exceptions that could diverge on settlement.
- Check the settlement source and timing (e.g., which official release, which time zone).
- Look for rounding rules and thresholds that could differ by a hair yet matter at the boundary.
A quick platform context: Kalshi vs Polymarket
Since the tool compares two specific venues, it helps to understand the basics of each:
- Kalshi: A U.S.-based, CFTC-regulated exchange for event contracts. Markets are framed as “Yes/No” outcomes with defined settlement criteria and official sources. Being regulated, Kalshi focuses on compliant categories and operates with traditional account funding and withdrawals.
- Polymarket: A crypto-native prediction platform that runs on-chain and settles in stablecoins. It features a wide range of event markets and uses a crypto wallet for access and settlement. Access and features can vary by jurisdiction, and U.S. persons face restrictions.
Why this matters for you: different participant bases, fee structures, and liquidity profiles often lead to different price reactions. Seeing those differences in one place is exactly where Kalshi vs Polymarket shines.
Data views that matter (and how to read them)
- Live price: A snapshot of the crowd’s current belief, expressed as a probability. Always pair this with liquidity context so you know how “stale” or “fragile” that print may be.
- Overlay chart: Great for event studies—who moved first on a headline, and which venue overshot or lagged.
- Side-by-side view: Good for immediate, at-a-glance comparisons without mental gymnastics.
- Recent trades: Helps you see whether moves were driven by a flurry of small trades or one large buyer/seller stepping in.
- Volume: Useful for gauging conviction and filtering out noise. Big moves on thin volume deserve more skepticism.
- Order books: Your best guide to near-touch liquidity, spreads, and where a “wall” might cap further moves unless it’s consumed.
Tips and best practices
- Confirm contract alignment: When in doubt, open each market’s full text. Small wording differences can create large outcome differences.
- Respect liquidity: A 5–10 point spread on a thin order book can evaporate once someone places a modest order. Look at depth before acting on a divergence.
- Watch time windows: Event time zones and posting schedules (like economic data at specific minutes) can create short-lived discrepancies. Zooming in helps tell signal from sync issues.
- Track catalysts: Put notable headlines right on your notes next to the overlay chart. Over time, you’ll learn which venue tends to lead on which types of news.
- Mind fees and friction: Your net edge depends on more than headline price. If you trade across venues, include costs, settlement timing, and capital constraints in your calculus.
Security and privacy
Because Kalshi vs Polymarket is a read-only, browser-based research tool with no signup, it’s easy to try without sharing personal information. You don’t connect wallets or fund accounts through it. Always conduct any actual trading actions only on the official platforms and verify you’re on the correct URLs before you log in or sign transactions.
Top Competitors and Alternatives
While Kalshi vs Polymarket focuses on a clean, two-platform comparison, you do have other options depending on your goal:
- Use the native platforms directly:
- Kalshi: Explore market pages, order books, and historical charts natively. This is best when you already know you’ll trade there and need platform-specific depth.
- Polymarket: The site provides live prices, charting, and a look at current liquidity. Good for rapid checks if you’re wallet-connected or primarily active there.
- Build a DIY dashboard:
- APIs: Pull market and trade data from each platform’s APIs where available, and align contracts in a spreadsheet or notebook.
- Custom analytics: Create cross-venue overlays tailored to your strategy, including your own signals and alerting rules.
- Community dashboards: Public dashboards (for example, on data visualization platforms) sometimes cover popular markets. These can be helpful, but quality and freshness vary.
- Other prediction platforms (if you’re expanding beyond these two):
- Manifold Markets: A play-money market with rich community coverage and fast listing. Great for idea discovery and crowd intuition, though incentives differ from real-money venues.
- Metaculus: A forecasting community with aggregated predictions and expert commentary. Not a trading venue, but excellent for research and calibration.
- Insight Prediction and other crypto-native markets: Useful to widen your event coverage if you want more venues with on-chain mechanics.
- PredictIt and other niche exchanges: Depending on availability and rules in your region, you may find specialized markets with their own participant bases.
If your main need is fast, clean parity checks between Kalshi and Polymarket, the Lychee viewer is hard to beat. If you want everything under one roof across many platforms, you’ll likely pair it with your own scripts or additional aggregators.
FAQs
Is it free?
Yes. Kalshi vs Polymarket is free to use and doesn’t require signup.
Can I place trades through it?
No. It’s a research and comparison interface. If you decide to trade, you’ll do so on Kalshi or Polymarket directly.
How often are prices updated?
The tool displays live or near-real-time prices from the platforms. Actual refresh speed can depend on data sources and your connection.
Does it support platforms beyond Kalshi and Polymarket?
It’s purpose-built for these two, which covers many of the most-watched real-money event markets. If you need more venues, you can complement it with DIY tools or other aggregators.
Is there an API?
The tool is a web app for interactive use. For programmatic needs, consider using the underlying platforms’ official data endpoints where available.
What about historical exports?
The site focuses on visual comparison. If you need bulk historical data, your best bet is to pull it from platform APIs or community-maintained datasets and build your own export pipeline.
What stands out in day-to-day use
Speed matters when you’re scanning for differences. The biggest compliment to Kalshi vs Polymarket is that it trims the “alt-tab tax.” You don’t have to juggle tabs, refresh multiple pages, and eyeball whether two lines kind of match. You type a query, land on the right pair, and immediately see where each market sits. The overlay view is especially useful around catalysts when you want to see who moved first and by how much.
Just as important, the interface doesn’t hide the plumbing. If you want to go beyond price, you can. Recent trades, volume, and order books ground your interpretation. If the divergence you see is propped up by thin depth, you’ll spot that quickly. If it’s anchored by steady flow, you’ll see that too.
Where it could grow
If you’re an advanced user, you might wish for more platforms, saved watchlists, or alerting. You can get those by pairing this tool with DIY scripts or other services. Still, the narrow focus is a strength: it keeps the page fast, legible, and free.
A note on responsibility and risk
Event trading is risky. Prices can move fast, liquidity can vanish, and settlement criteria can surprise you if you miss a detail. Treat cross-platform differences as a starting point, not a guarantee. Read market text carefully, factor in all costs and constraints, and make your own independent judgment. Nothing here is financial advice.
Verdict: Who should use Kalshi vs Polymarket?
If you actively monitor events on Kalshi and Polymarket—or if you write about what markets think—this tool is a straightforward win. It’s fast, it’s free, and it shows you what you actually care about: where these two important venues agree, where they diverge, and how they got there.
It won’t replace a full-blown data engineering stack for quants. But it will save you time every day, reduce context switching, and make your notes and screenshots far more compelling. For many traders and researchers, that combination is enough to make it a default tab.
Wrapping Up
Kalshi vs Polymarket by Lychee does exactly what its tagline promises: One event. Two markets. Different odds. It gives you a clean, dependable way to search in plain English or by ticker, find matching contracts on Kalshi and Polymarket, and compare live YES/NO prices with context from trades, volume, and order books. You can put the markets side by side or overlay them to watch how each reacts over time.
It’s free, requires no signup, and fits nicely into trader, analyst, and journalist workflows. If you care about seeing the whole picture instead of a single-venue snapshot, you’ll find it invaluable.
Try it here: https://lycheedata.com/kalshi-vs-polymarket-odds.
And whether you use this tool or roll your own stack, remember the fundamentals: confirm the market text, respect liquidity, time your comparisons around catalysts, and always account for costs and constraints. Do that consistently, and your odds of making better, more informed decisions will improve—no matter which venue you ultimately choose to trade.